


The major reason for statistics is to test a hypothesis. Hypothesis testing... what's this all about. Before we dive into hypothesis testing let's get to know what hypothesis is all about.
What is a Hypothesis?
The American Heritage Dictionary defines a hypothesis as, "a tentative explanation for an observation, phenomenon, or scientific problem that can be tested by further investigation." In other words, A hypothesis is an educated guess about something in the world. It should be testable, either by experiment or observation. Like anything else in life, there are many paths to take to get to the same ending. It can be anything at all as long as you can put it to the test.
What is Hypothesis Testing
Hypothesis testing is about testing to see whether the stated hypothesis is acceptable. During this hypothesis testing, we will gather as much data as we can to validate our hypothesis. The general idea of hypothesis testing involves:
- Making an initial assumption.
- Collecting evidence (data).
- Based on the evidence (data), deciding if to reject the initial assumption.
PermalinkSteps to conducting a hypothesis testing
There are four steps to conducting hypothesis testing.
Step One: Plan the hypothesis
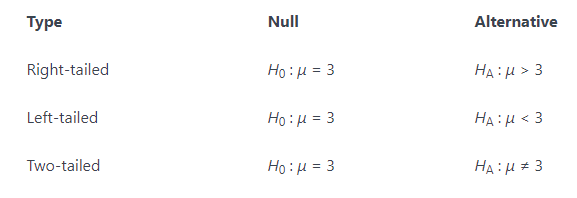
The first step is that of writing the hypothesis. You have two hypotheses to write. One is the null hypothesis -Think of this as the hypothesis that states how you would expect things to work with no external factors to change it. The other is the alternative hypothesis -this is the hypothesis that shows a change from the null hypothesis that is caused by something. For example:
In hypothesis testing, we just test to see if our data fits our alternative hypothesis or if it fits the null hypothesis. We don’t worry about what is causing our data to shift from the null hypothesis if it does. Keep in mind, when writing your null hypothesis and alternative hypothesis, we must write them in such a way so that if the null hypothesis is false, then the alternative hypothesis is true and vice versa.
Step Two: t-statistics
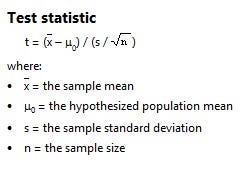
The test statistic is a single measure that captures the statistical nature of the relationship between observations you are dealing with. The test statistic depends on the number of observations that are being tested. It differs from situation to situation.
You construct a test statistics, and you compare it to a critical value(or values) to determine whether we should reject the null hypothesis. The specific test statistics and critical value (s) depend on which population parameter is being tested, the size of the sample being used, and other factors.
Step Three: Cut-off Value for t-statistics
Determine the critical value by finding the value of the known distribution of the test statistic such that the probability of making a Type I error — which is denoted α (Greek letter “alpha”) and is called the “significance level of the test” — is small (typically 0.01, 0.05, or 0.10). Formular for t-cutoff;
# t-cutoff = +/- |T.INV(α/2, n-1)
Step Four: Check If t-statistics falls in the rejection region
Compare the test statistic to the critical value. If the test statistic is more extreme in the direction of the alternative than the critical value, reject the null hypothesis in favor of the alternative hypothesis. If the test statistic is less extreme than the critical value, do not reject the null hypothesis.
Errors in Hypothesis Testing
We make our decision based on evidence not on 100% guaranteed proof. Again:
- If we reject the null hypothesis, we do not prove that the alternative hypothesis is true.
- If we do not reject the null hypothesis, we do not prove that the null hypothesis is true.
We merely state that there is enough evidence to behave one way or the other. This is always true in statistics! Because of this, whatever the decision, there is always a chance that we made an error.
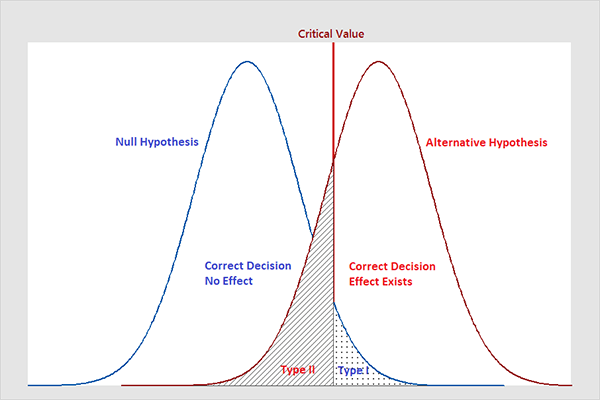
Note that, in statistics, we call the two types of errors by two different names — one is called a “Type I error,” and the other is called a “Type II error.” Here are the formal definitions of the two types of errors:
- Type I Error
The null hypothesis is rejected when it is true.
- Type II Error
The null hypothesis is not rejected when it is false.
There is always a chance of making one of these errors.
Summary
Key terms and concepts:
Null hypothesis: Null hypothesis is a statistical hypothesis that assumes that the observation is due to a chance factor. The null hypothesis is denoted by; H0: μ1 = μ2, which shows that there is no difference between the two population means.
Alternative hypothesis: Contrary to the null hypothesis, the alternative hypothesis shows that observations are the result of a real effect.
Level of significance: Refers to the degree of significance in which we accept or reject the null-hypothesis. 100% accuracy is not possible for accepting or rejecting a hypothesis, so we, therefore, select a level of significance that is usually 5%.
Type I error: When we reject the null hypothesis, although that hypothesis was true. Type I error is denoted by alpha. In hypothesis testing, the normal curve that shows the critical region is called the alpha region.
Type II errors: When we accept the null hypothesis but it is false. Type II errors are denoted by beta. In Hypothesis testing, the normal curve that shows the acceptance region is called the beta region.
One-tailed test: When the given statistical hypothesis is one value like H0: μ1 = μ2, it is called the one-tailed test.
Two-tailed test: When the given statistics hypothesis assumes a less than or greater than value, it is called the two-tailed test.
Thanks for reading!
Special thanks to the following resources